What Is a Good ROAS? 2026 Benchmarks for ROAS, CPM and CAC
Two advertisers both report a 2.5x return on ad spend. One of them is growing a profitable business and the other is losing $20 on every order. The ROAS is identical. The difference is gross margin and that single fact is why most “what is a good ROAS” answers leave people with the wrong target.
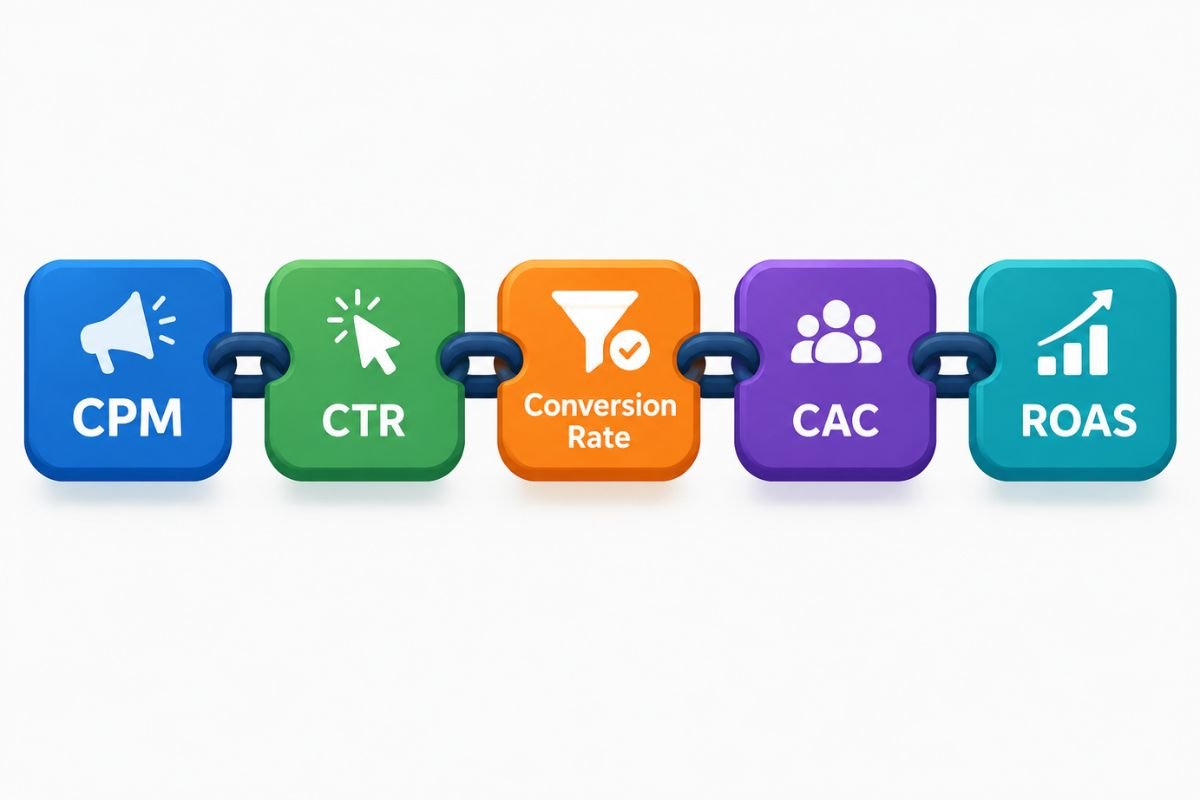
This guide gives you the published benchmarks for ROAS and for the three numbers that sit around it: CPM, CAC and engagement rate. It also does something benchmark lists rarely do. It connects the numbers into one chain so you can see which one to fix first when a result looks bad.
Quick reference: what is a good number in 2026
Treat every figure as a range. The ranges come from 2026 benchmark guides that aggregate platform and advertiser data and none is a single audited study.
| Metric | Typical range | What changes it most |
|---|---|---|
| ROAS, DTC ecommerce blended | 3x to 5x | Gross margin and channel mix |
| ROAS, Meta | 2x to 4x | Audience and creative |
| ROAS, Google Shopping | 4x to 8x | Product category |
| CPM, Meta | $6 to $15 | Objective and audience size |
| CPM, TikTok (auction) | $10 to $20 | Targeting and season |
| CPM, LinkedIn | $30 to $60 | Job title and seniority targeting |
| CAC payback, DTC ecommerce | About 3 to 4 months | Order value and repeat rate |
| Engagement rate, Instagram | About 4.3 percent | How the rate is defined |
The rest of the guide explains how to read each row.
A good ROAS starts with your margin
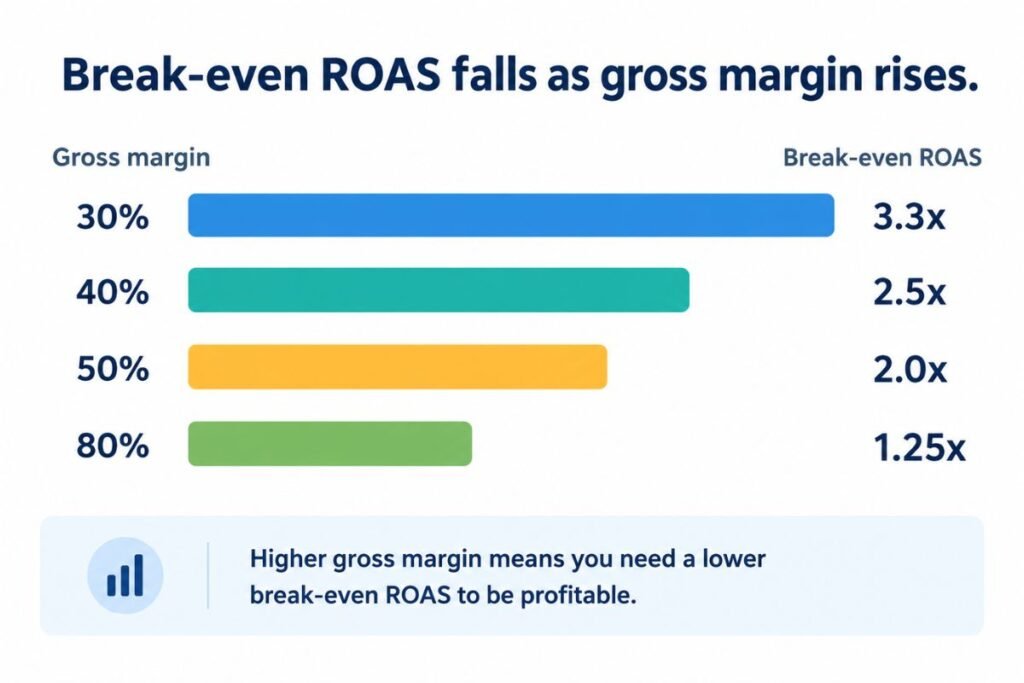
ROAS is revenue from ads divided by ad spend. It says nothing about profit until you set it against gross margin. The break-even point is simple. Divide 1 by your gross margin percentage.
| Gross margin | Break-even ROAS |
|---|---|
| 30 percent | 3.3x |
| 40 percent | 2.5x |
| 50 percent | 2.0x |
| 80 percent | 1.25x |
A store with a 40 percent margin needs 2.5x just to cover the ad cost of each sale. That is why the two advertisers above had opposite outcomes. The same guide points out that fulfilment and returns and overhead push the real target well above break-even. A direct to consumer brand with 50 percent margins and 15 percent fulfilment costs and a 10 percent profit goal needs roughly 4x.
So the first step in judging any benchmark is to write down your own break-even. You can work out your break-even ROAS in a minute. If you are unsure how margin differs from markup read how gross margin works first because mixing the two gives a wrong target.
What is a good ROAS by channel
With your break-even in hand the channel ranges become useful. They show what is realistic rather than what is profitable.
| Channel | Typical ROAS | Note |
|---|---|---|
| Google Shopping | 4x to 8x | 6x or more for top quartile accounts |
| Google Search, non-branded | 3x to 7x | 2x to 4x in competitive fields such as insurance or legal |
| Google Search, branded | 8x to 15x and up | Captures existing demand and finds few new customers |
| Meta (Facebook and Instagram) | 2x to 4x | 4x to 7x for top accounts |
| TikTok | 2x to 4x | Below 2x often points to a creative and audience mismatch |
These figures come from Prooflytics (May 2026) and use a 7 day click and 1 day view attribution window for Meta and TikTok. Branded search deserves a warning. A very high ROAS there mostly reflects people who were already looking for you so do not use it to judge the paid media that finds new customers.
Not every business should use ROAS at all. The same source recommends a marketing efficiency ratio for B2B software and notes that for fintech the more useful pair is CAC against lifetime value. If your product has a long sales cycle read the CAC section below before setting a ROAS goal.
What is a good CPM
CPM is what you pay for a thousand ad impressions. It is a cost of reach and not of results so a low CPM is not automatically good. Published 2026 ranges by platform look like this.
| Platform | Typical CPM |
|---|---|
| Meta (Facebook and Instagram) | $6 to $15 |
| TikTok (auction) | $10 to $20 |
| YouTube in-stream | $5 to $15 |
| $30 to $60 | |
| Google Display | $0.50 to $2.00 |
Inside Meta the spread is wide. Awareness campaigns run near $4 to $8 and conversion campaigns near $10 to $20. Broad audiences cost about $5 to $10 while retargeting audiences cost $12 to $25 (Prooflytics, May 2026). Season matters too. Meta CPMs run roughly 30 to 60 percent above the second quarter level in the fourth quarter and fall back in the first.
Read CPM together with click through rate. A rising CPM with a falling CTR points to audience saturation or tired creative. A rising CPM with a steady CTR points to competition or season. You can check a campaign’s CPM from spend and impressions and compare it with the ranges above.
The chain that links CPM to ROAS
The five numbers in this guide are not separate scores. CPM feeds click cost and click cost feeds CAC and CAC feeds ROAS. Here is one example worked through the whole chain.
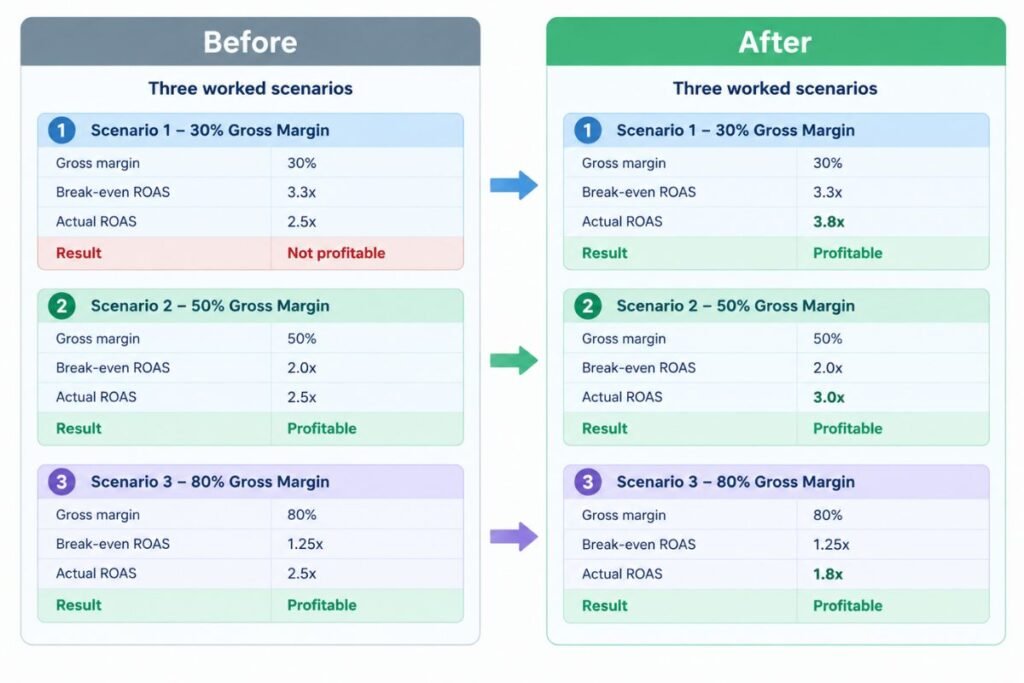
An advertiser pays a $12 CPM and gets a 1 percent click through rate. A thousand impressions then produce 10 clicks so each click costs $1.20. With a 3 percent conversion rate the cost per order is $40. If the average order is $100 the ROAS is 2.5x. At a 40 percent gross margin each order earns $40 of gross profit so the campaign exactly breaks even.
Now change one link at a time.
| Scenario | CPM | CTR | Conv. rate | Cost per click | CAC | ROAS | Profit per order |
|---|---|---|---|---|---|---|---|
| Base case | $12 | 1.0% | 3% | $1.20 | $40.00 | 2.5x | $0 |
| Better creative | $12 | 1.5% | 3% | $0.80 | $26.67 | 3.75x | $13.33 |
| Weaker landing page | $12 | 1.0% | 2% | $1.20 | $60.00 | 1.67x | -$20 |
A half point gain in click through rate turns a break-even campaign into a profitable one. A one point drop in conversion rate turns it into a loss. Neither change touched the CPM. That is the practical value of the chain. When ROAS looks bad you can read left to right and find the first link that broke.
What is a good CAC
Customer acquisition cost is total sales and marketing spend divided by the number of new customers. Whether a CAC is good depends on what each customer is worth and how fast they repay it. Digital Applied (April 2026) reports median CACs of about $94 for direct to consumer apparel and $71 for beauty and $58 for food and beverage. For B2B services and agencies it reports about $1,840. The same guide notes that paid CAC runs roughly 2.4 to 3.1 times blended CAC so report both.
Two ratios turn a CAC into a verdict.
- LTV to CAC. A common floor is 3 to 1. Below it marketing spend compounds more slowly than the capital behind it. A ratio far above 5 can mean you are not investing enough in growth.
- Payback period. Direct to consumer ecommerce targets about 3 to 4 months. Subscription direct to consumer targets under 6 months. SaaS companies tolerate longer, with 12 to 18 months common for mid sized firms.
You can calculate your own CAC and then compare it with the figures for your model. Be careful with industry medians. The same source says the top quartile column is the better guide for setting targets because medians include weak performers.
What is a good engagement rate
Engagement rate belongs to organic and creator content. It measures how often followers react and not what a click costs. Buffer’s January 2026 benchmarks report median rates of about 4.3 percent on Instagram and 3.6 percent on Facebook. TikTok averages near 4.9 percent. X sits near 2.2 percent and LinkedIn near 6.5 percent. The definition in that study is likes and comments and shares divided by followers.
Definitions vary between tools. Some divide by reach and others by impressions so a 4 percent rate in one report is not the same as 4 percent in another. Compare your rate only against a benchmark that uses your own formula. You can measure your engagement rate with the same follower based method used above.
Engagement also drives creator pricing. Brands pay for audiences that react and not only for audiences that exist. If you work with creators you can set an influencer rate that reflects both reach and engagement.
Why the same campaign shows different ROAS in different reports
Two reports on the same campaign can disagree by a full point of ROAS and neither is wrong. The cause is almost always the attribution window and the tool doing the counting. A platform that credits a sale to any ad seen in the past day will report a higher ROAS than analytics that only credits the last click. A 7 day click window will report more revenue than a 1 day window because buyers often return days after the first visit.
Pick one source of truth before you compare anything to a benchmark. Many teams use the ad platform for day to day optimisation and their store or accounting numbers for the monthly verdict. Whatever you choose, keep it fixed. A benchmark only means something when your number was measured the way the benchmark was.
Mistakes that make a good result look bad (and the reverse)
- Judging a new campaign too early. Ad platforms need roughly a week of steady spend to settle. Early ROAS and CPM swing widely and say little.
- Comparing across objectives. An awareness campaign will show a low ROAS by design. Judge it on reach and CPM and judge a conversion campaign on ROAS.
- Ignoring returns and discounts. Revenue before refunds overstates ROAS. Use net revenue if returns are common in your category.
- Using a blended number to defend one channel. A strong total can hide a channel that loses money. Look at each channel against its own break-even.
- Copying a competitor’s target. Their margin is not yours. A rival with an 80 percent margin can run profitably at 1.5x while you cannot.
Which number to fix first
Use the chain to diagnose a weak result in order.
- Weak ROAS with a normal CPM. Look at click through rate and conversion rate. These two decide cost per order.
- High CPM with a low CTR. The audience is too narrow or the creative is tired. Broaden the audience or refresh the ad before touching the budget.
- Healthy CTR with a low conversion rate. The ad is working and the page or offer is not. Fix the landing page and pricing first.
- Good ROAS but a poor payback period. You are winning first orders and losing on repeat purchases. Improve retention before spending more.
- Strong ROAS only on branded search. You are measuring demand you already had. Judge paid media on non-branded results.
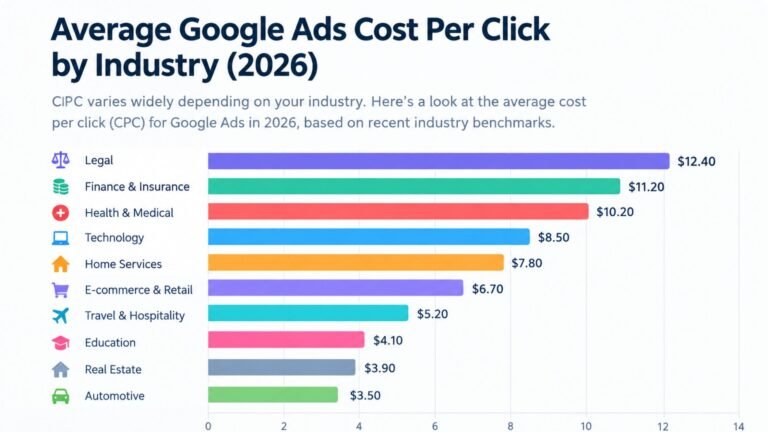
If clicks are the weak link start with Google Ads cost per click benchmarks to see whether your click cost is unusual for your market.
Frequently asked questions
Is a 3x ROAS good?
It depends on your gross margin. Break-even ROAS is 1 divided by gross margin so a 3x return makes money at a 50 percent margin but loses money at a 25 percent margin where break-even is 4x.
What is a good ROAS for Google Ads?
Published 2026 benchmarks put non-branded Google Search at about 3x to 7x and Google Shopping at about 4x to 8x. Branded search often shows 8x or more but it mostly captures demand that already existed.
What is a good CPM for Facebook and Instagram ads?
Meta CPMs commonly fall between $6 and $15 with awareness campaigns near $4 to $8 and conversion campaigns near $10 to $20. Retargeting audiences cost more than broad audiences.
What is a good customer acquisition cost?
A good CAC is one your customers repay quickly. A common rule is a lifetime value at least three times CAC and a payback period under about four months for direct to consumer ecommerce.
What is a good engagement rate on social media?
Buffer’s 2026 benchmarks report medians of about 4.3 percent on Instagram and 3.6 percent on Facebook with TikTok near 4.9 percent and X near 2.2 percent. Definitions vary between tools so compare like with like.
Check your own numbers this week
Pull last month’s spend and revenue and gross margin. Calculate your break-even ROAS and compare it with your actual ROAS. Then write the chain for one campaign from CPM to CAC. Wherever your number sits outside the ranges above is the link to fix first. Change only that one link for the next two weeks and leave everything else alone. If you change the creative and the audience and the landing page together you will not know which change moved the result so the chain will stop telling you where the problem is.