Google Local Service Ads Cost: What You’ll Pay in 2026
You turned on Local Service Ads because someone told you it was cheaper than Google Ads. Now you are looking at your weekly spend and a lead count that does not match what you expected. You have no idea whether the number you are paying is normal or whether you are getting overcharged. Google does not publish a price list. Every agency selling LSA management has its own version of “typical.” Most of those numbers exist to make their own service look like a bargain by comparison.
Before you decide whether to raise your budget, lower it or drop LSA entirely, you need a real number to compare against, not a guess dressed up as an average. The section below breaks down what Local Service Ads actually costs by trade, using benchmark data from real contractor accounts rather than a marketing claim. It also shows exactly how the pricing mechanic works so you can read your own dashboard correctly. It flags where most contractors accidentally overpay without realizing it.
How Google Local Service Ads pricing actually works
Local Service Ads runs on a pay per lead model. That is the single fact that separates it from a standard Google Ads campaign. It explains almost every question people have about the google local service ads cost line on their invoice, from why the charge appears after a phone call instead of after a click to why two contractors in the same trade can see very different totals at the end of the week.
Google only charges you when a potential customer calls or messages you through your LSA listing. You are not charged for impressions. You are not charged for profile views. You are not charged for clicks that never turn into contact. That is a fundamentally different pricing structure from a Google Ads search campaign, where you pay for every click regardless of what happens after someone lands on your site.
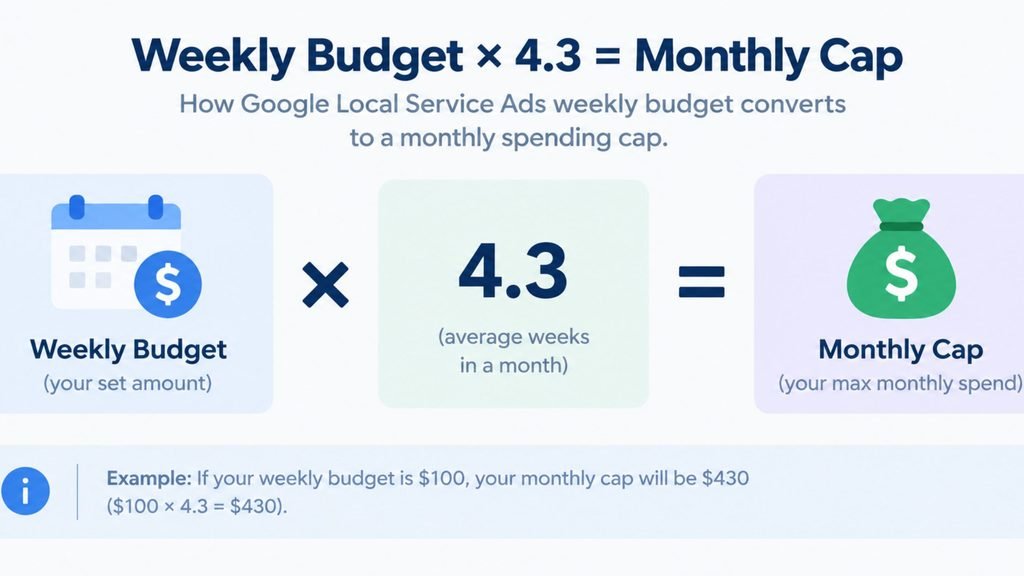
Instead of setting a bid per lead, you set an average weekly budget. Google converts that into a monthly spending cap by multiplying your weekly number by roughly 4.3. Once you hit that cap, your ads pause until the next billing cycle or until you raise your budget. Lead pricing itself, meaning what Google actually charges for each individual lead, is set by Google based on your trade, your market and the level of competition in your specific service area. You do not control that number directly. You control how many leads you are willing to pay for. You also control how quickly you respond once one arrives.
This is also why the exact search term “google local service ads pricing” pulls up conflicting answers everywhere you look. There is no fixed rate card. Two electricians in different cities can pay very different amounts for what looks like the same lead.
What actually drives your google lsa cost
A handful of factors move your price up or down. Most of them are things you can influence directly, without waiting on Google to change anything on its end.
Location and job type set the baseline. A water heater replacement lead costs more than a routine electrical inspection lead because the underlying job value is higher and competition for that specific service is different market by market.
Lead type matters too. A message lead often costs less than a phone call lead, because Google’s system weighs the estimated likelihood that a message converts into an actual booking differently than a call.
Your bid mode plays a role. It is not the only lever. Google’s own guidance is explicit that bidding can move your listing up in results. Quality signals still count on top of that. Two things carry real weight here: how fast you respond to leads during your stated business hours and your review volume and star rating.
A contractor who answers within minutes and has fifty reviews at 4.8 stars will often out-rank a competitor who is bidding more aggressively but responds slowly or has a thin review profile. This is the practical meaning behind the search term “google lsa phone response score.” Respond fast and respond during the hours you say you are open. That combination alone tends to improve your relative cost per lead over time even without touching your budget.
The Google Guaranteed badge is part of this picture as well. Getting background checked and licensed through Google’s verification process is what makes you eligible to show the badge. It functions as a trust signal that factors into whether a customer chooses to contact you over a competitor without it. That choice, multiplied across every listing in a crowded market, is what indirectly affects how efficiently your budget converts into paying work.
Google local service ads cost per lead by trade in 2026
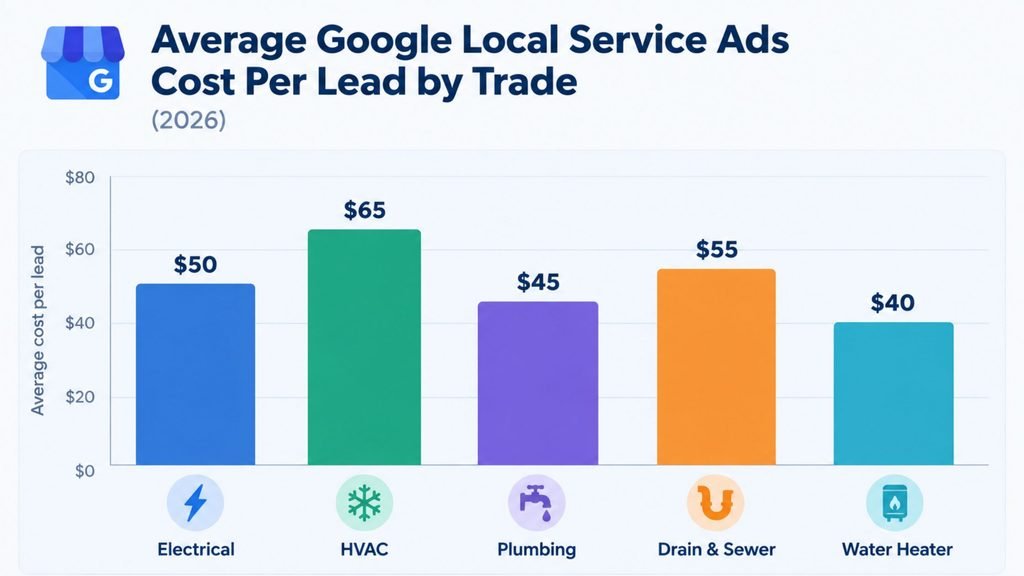
Here is where most guides get vague. A February 2026 benchmark study across 888 contractor accounts gives an actual, cited breakdown instead of a rounded estimate.
| Trade | Average cost per lead | Book rate | Average ticket | Return on ad spend |
|---|---|---|---|---|
| Electrical | $39 | 43.4% | $1,434 | 8.52x |
| HVAC | $51 | 44.0% | $2,110 | 9.55x |
| Plumbing | $57 | 44.5% | $1,714 | 6.85x |
| Drain and sewer | $59 | 39.5% | $1,521 | 5.50x |
| Water heater | $71 | 35.0% | $2,484 | 5.13x |
| Blended average | $53 | 43.9% | $1,826 | 7.84x |
A few things stand out. Electrical work has the lowest cost per lead in this set at $39, yet it does not have the best return, because the average ticket value is also the lowest of the group. Water heater work costs the most per lead at $71. The return still lands above 5x because the job value is high enough to absorb it.
Book rate, meaning the share of leads that actually turn into paid work, sits in a narrow band across every trade here, between 35 and 44.5 percent. That is useful context on its own. If roughly 4 in 10 leads convert to a booked job industry-wide and your own rate is well below that, the problem is more likely your response speed or your pricing on the call itself than the lead source.
If you are searching variations like “hvac contractor local service ads lsa,” “electrician local service ads lsa,” or “google lsa for plumbing companies,” this table is the answer. Your trade sets your starting point. Everything in the section above (response speed, reviews, the Google Guaranteed badge) is what moves you above or below that baseline.
Google local services ads payment model versus a standard Google Ads campaign
This is the comparison almost every guide skips. It is the one that actually matters when you are deciding where your next marketing dollar goes.
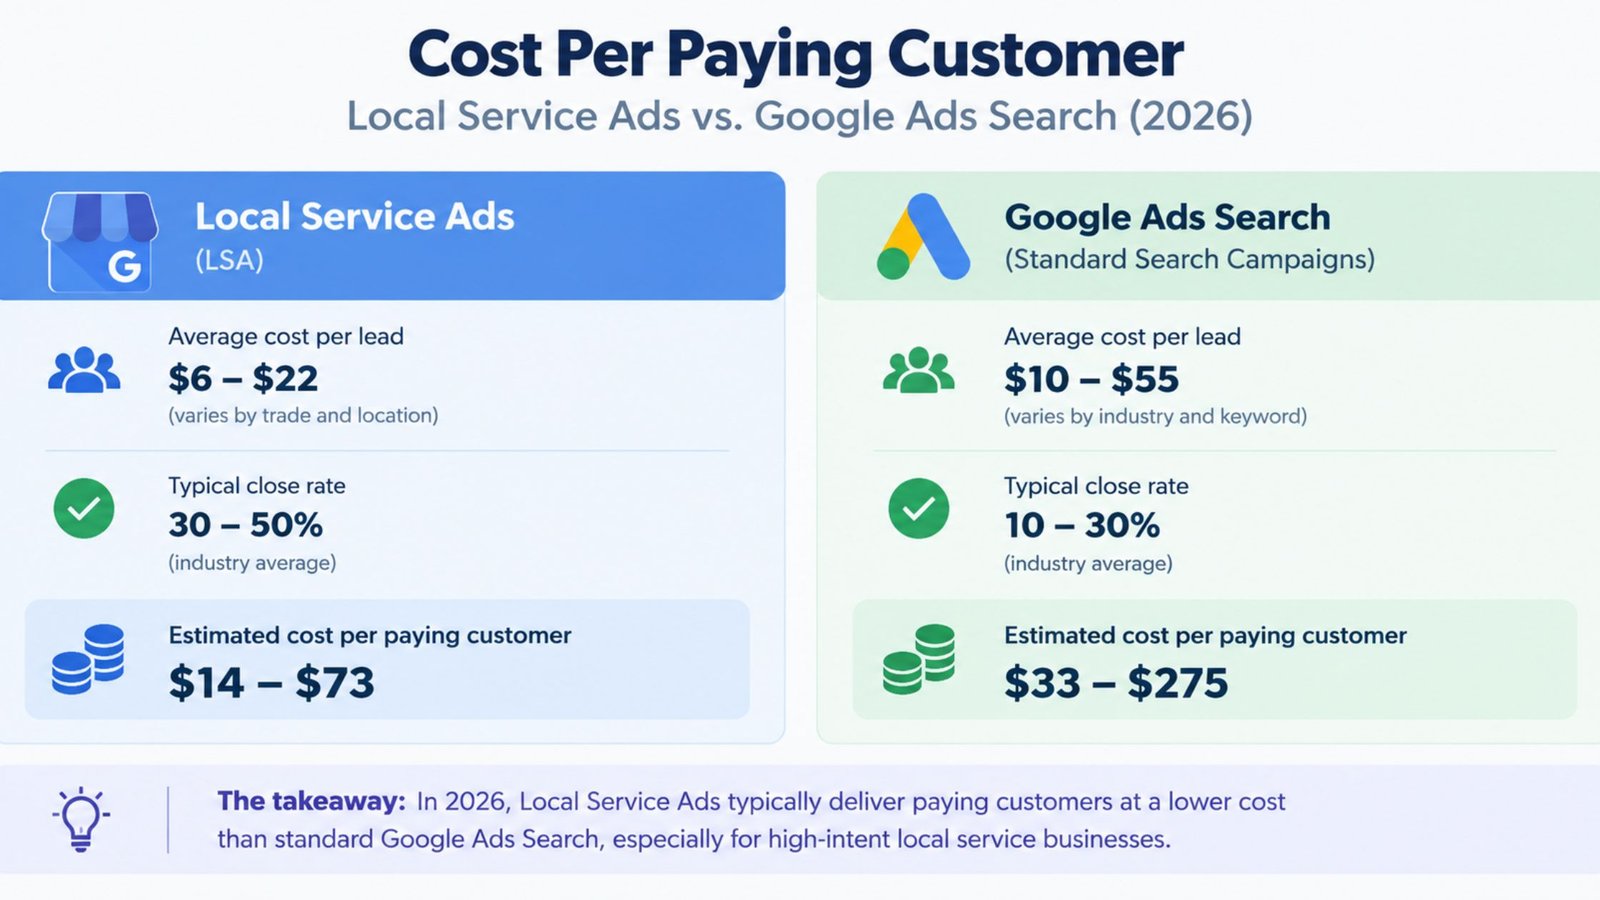
In the same benchmark period, cost per paying customer averaged $233 on Local Service Ads. On standard Google Ads Search, the comparable figure averaged $472, roughly double. The reason comes back to the billing mechanic covered above. A Google Ads budget has to absorb every click, including the ones from people who were never going to call, who compare prices and leave or who land on the wrong page entirely. LSA strips that waste out by charging only for an actual contact.
This does not mean Google Ads is a bad channel. It means the two tools solve different problems. A standard search campaign gives you control over targeting, ad copy and landing page experience. It works for services where LSA either is not available in your category or your market is not dense enough to generate volume.
Local Service Ads trades that control for a leaner cost structure on a narrower set of eligible trades. If you already run both, the cost per click you are paying on your search campaign is the direct number to weigh against the cost per lead figures above, since both ultimately answer the same question: what does it cost you to get one real prospect in front of your business.
Most businesses running both end up treating LSA as the leaner, higher-intent channel and Google Ads as the layer that covers services or search terms LSA does not reach.
How to set your budget without guessing
Google’s automated bidding system needs time and data to work properly. It takes roughly two weeks to stabilize after you launch or make a significant budget change. During that window, your cost per lead can look worse than it will settle at once the system has enough conversion data to price efficiently.
Google’s own guidance recommends setting a budget that supports around 10 leads per week as the minimum for the automated system to function well. Below that threshold, the algorithm does not get enough signal to optimize your placement. Your effective cost per lead tends to run higher and more erratic than the benchmark figures above as a result.
A practical way to size your starting budget: take the average cost per lead for your trade from the table above, then multiply it by your target weekly lead count, using 10 as a floor and going higher only if your market clearly supports it. That gives you your weekly budget number. Multiply that by 4.3 for your expected monthly spend. Run your own trade and target lead volume through the Local Service Ads Calculator to get a number specific to your situation rather than the blended industry average.
Treat your first month as a calibration period rather than a verdict. The two-week stabilization window means your earliest cost per lead numbers are the least reliable ones you will see. Wait for a full billing cycle before deciding your budget is too high, your trade is too competitive or the channel simply is not a fit for your business.
Worked example
A plumbing company wants to book 8 new jobs a month through LSA and knows their book rate runs close to the industry average of 44.5 percent from the table above.
| Step | Calculation | Result |
|---|---|---|
| Leads needed for 8 booked jobs | 8 divided by 0.445 book rate | 18 leads/month |
| Weekly lead target | 18 leads divided by 4.3 weeks | About 4.2 leads/week |
| Cost per lead (plumbing average) | From benchmark table | $57 |
| Weekly budget | 4.2 leads times $57 | About $240/week |
| Monthly spend | $240 times 4.3 | About $1,032/month |
| Cost per booked job | $1,032 divided by 8 jobs | About $129/job |
Against an average plumbing ticket of $1,714 from the same benchmark, a $129 acquisition cost per booked job is the kind of return that makes the pay per lead model worth the spend, assuming your response speed and reviews keep your actual cost near the trade average rather than above it.
Common mistakes that push your cost per lead higher
Most contractors who feel like they are overpaying are not victims of a broken system. They are losing money to a handful of fixable habits.
Slow response times. Every benchmark on Local Service Ads ties ranking and effective cost to response speed. A lead you answer in two minutes and a lead you answer in two hours were priced the same by Google. Only one of them has a realistic shot at becoming a booked job.
Gaps in your stated business hours. If your profile says you are open until 6pm but leads stop getting answered at 4pm, Google’s system eventually treats you as less reliable during that window. Your relative placement drifts down without your budget changing at all.
Ignoring your review profile. Review volume and rating are ranking inputs, not just marketing decoration. A contractor sitting on twelve reviews is competing against one sitting on eighty. Asking every satisfied customer for a review is one of the few cost-per-lead levers that costs nothing to pull.
Service area set too wide. A broad radius sounds like more opportunity. In practice it pulls in leads you were never realistically going to book. It drags down your book rate and makes your effective cost per booked job look worse than your raw cost per lead suggests.
Never disputing a bad lead. Not every charged lead is a real one. Contractors can dispute leads that turn out to be spam, outside their stated service area or wrong service type entirely. Industry data puts the typical credited dispute rate at roughly 6 to 7 percent of total leads. It will not zero out a bad month. Checking your lead log against your actual service area and disputing anything that clearly does not belong is a routine part of managing your google local services ads cost month to month, not an edge case you handle once and forget.
Frequently asked questions
How much does Google Local Service Ads cost per lead?
Across a February 2026 benchmark of 888 contractors, the blended average cost per lead was $53. Electrical leads averaged $39, HVAC averaged $51, plumbing averaged $57, drain and sewer averaged $59 and water heater work averaged $71. Your actual cost depends on your trade, market and level of local competition.
Is Local Service Ads cheaper than Google Ads?
In the same benchmark period, cost per paying customer averaged $233 on Local Service Ads versus $472 on standard Google Ads Search, roughly half. LSA only charges for a call, message or booking. It does not charge for clicks that never convert.
How does Google Local Service Ads billing work?
You set a weekly budget rather than a per-lead bid. Google charges you only when a customer calls or messages through your listing. It does not charge for impressions, profile views or clicks that do not result in contact. Your weekly budget multiplied by roughly 4.3 sets your monthly spending cap.
What affects your Local Service Ads cost per lead?
Google prices leads based on your location, job type, lead type (call, message or booking) and your bid mode. Ranking position is also weighted by response speed to leads during your stated hours and your review volume and rating, alongside your bid.
Can you dispute a Local Service Ads charge?
Yes. Contractors can dispute leads that are spam, outside their service area or otherwise invalid. Industry data shows roughly 6 to 7 percent of leads get credited back through disputes.
What is the minimum budget for Local Service Ads to work?
Google’s automated bidding needs about two weeks to stabilize. It works best with a budget that supports roughly 10 leads per week. A budget set far below that range may not generate enough data for the system to price and place your leads efficiently.